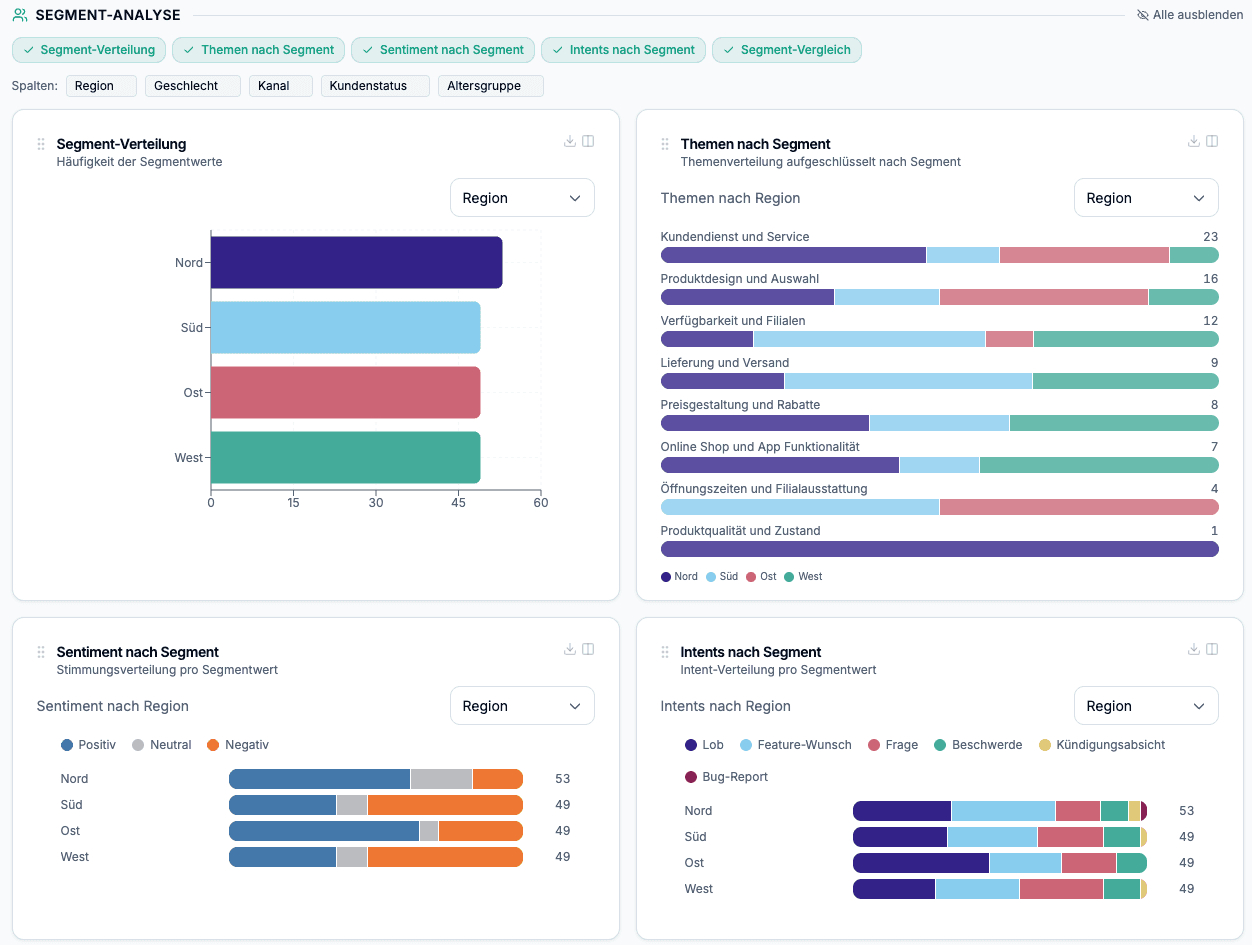
Segment Analysis: Compare across all dimensions
How does feedback differ by region, customer group, or channel? Segment columns are automatically detected — no configuration needed.
Auto
segment detection
∞
comparison dimensions
Yes
interactive cross-tabs
The Challenge
Same question, different answers
Averages hide important differences. Customers in Region A have different problems than in Region B. Without segment comparisons, you make decisions based on averages — and miss the target audience.
- Regional differences remain invisible
- Customer groups have different needs
- Channels show different feedback patterns
How it works
Topic × Segment cross-table
| Topic | Region North | Region South | Region West |
|---|---|---|---|
| Delivery time | 38% | 12% | 25% |
| Product quality | 15% | 42% | 20% |
| Customer service | 22% | 18% | 35% |
Features
What segment analysis can do
Automatic detection
Columns with categorical values are automatically detected as segments.
Interactive cross-tables
Topic × Segment, Sentiment × Segment, NPS × Segment — with drill-down.
Segment comparisons
Compare results across regions, customer groups, time periods, and channels.
Drill-down into comments
From cross-table directly to individual comment — every value is traceable.
FAQ
Frequently asked questions
Use Cases
Ideal for
Regional comparisonsCustomer group analysisChannel comparisonsTime series analysisBenchmark studiesMulti-market research
Combine with other features
See your open responses as structure – not as a wall of text
Start directly with your own data or validate your use case with guidance – including stakeholder assurance.
Request Demo
No credit card required
Personal support
GDPR-compliant
Made in Germany